mercredi 22 juillet 2020

Le système électrique au Royaume-Uni


Le système électrique au Royaume-Uni

Les leçons d'un succès
Jean Pierre Riou 

L’économiste Guillaume Gaulier a publié quelques graphiques extrêmement révélateurs sur l’efficacité des politiques énergétiques européennes. Chacun d’eux ne saurait montrer qu’un aspect du problème, l’évolution du rapport entre émissions de CO2 et PIB en base 100 depuis 2002 semble particulièrement pertinent.

Dans cette comparaison, l’efficacité du Royaume-Uni se détache clairement de celle des autres pays européens à partir de 2012.

Ce qui justifie l’examen des mesures ayant permis ce succès.
Car la sortie du charbon du Royaume-Uni est une réussite incontestable de sa politique  climatique.
Le graphique ci-dessous montre sans équivoque l’effondrement de sa consommation à partir de 2012.

 Source Digest of Energy Statistics 2019 UK.Gov

Et précise la part prépondérante de la production d’électricité (en gris) et sa réduction drastique à partir de 2012.
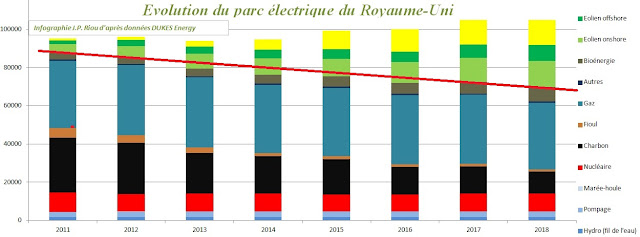
Performance d'autant plus remarquable que cette sortie du charbon du mix électrique s’est accompagnée d’une réduction en termes de puissance pilotable installée, illustrée sous la ligne rouge du graphique ci-dessous. 


Infographie : au 31 décembre de chaque année selon National Statistics, Gov.UK 5-12

Ce qui fait figure d’exception en Europe, où le formidable essor des EnRe intermittentes (éolien/PV) n’a toujours pas permis de réduire la puissance pilotable installée d’un seul MW.

Le signal prix de la taxe plancher
Dans son analyse, sur Le signal prix du CO2, * RTE rappelle que « La gestion de l’équilibre entre l’offre et la demande d’électricité repose sur une logique de préséance économique qui définit « l’ordre d’appel » et montre qu’en l’absence de taxation du carbone, c’est le lignite qui serait appelé prioritairement en raison de son faible coût marginal (5€/MWh), juste après les EnR dont ce coût est nul.
Tandis que celui du gaz, beaucoup moins émetteur, se situe entre 35 et 45€/MWh.
Le système européen d’échange de quotas d’émissions (SEQE-UE), dont dépendent les centrales électriques, est destiné à favoriser la compétitivité des centrales les moins émettrices. Son taux demeure cependant trop bas pour être encore efficace.
L’étude montrait qu’en 2016, le taux actuel des quotas carbone (7€ la tonne) n’empêchaient pas le lignite et même le charbon d’être plus compétitifs que le gaz, et donc d’être appelés avant lui.

Or le Royaume Uni a instauré en 2011 un prix plancher sur cette valeur du carbone (CTF).
Toujours selon RTE, cette taxe anglaise a eu le double effet antagoniste de réduire la production du charbon anglais, mais aussi de dévaloriser les quotas carbone européens en augmentant mécaniquement la quantité de quotas restant disponibles. Et, par la même, de favoriser les émissions de CO2eq des autres pays.
D’autre part, parmi les différentes mesures incitatives, le système de « Contract for difference » (CFD) est considéré comme le levier le plus efficace pour soutenir la production d’énergies bas carbone.
Il est important de noter que le nucléaire britannique bénéficie de ce mécanisme au même titre que les énergies renouvelables, ainsi que le rappelle l’analyse de l’Agence Internationale de l’Energie (AIE) (p 29).

Selon la Banque Mondiale, cette taxe plancher du Royaume Uni impose le plus fort taux au monde, avec celui de l’Espagne, du Danemark et de l’Irlande, à 25$/tCO2eq en 2018, tandis que le système d’échanges européens la taxait à 16$.

Cette taxation a été déterminante dans la réduction spectaculaire des émissions de CO2eq de la production électrique britannique. Tandis qu’en France, le projet de prix plancher du carbone, annoncé depuis 2015, puis envisagé pour les  seules centrales à charbon a été refusé du projet de loi de finance 2017.

La baisse de la consommation
D’autre part, le Royaume Uni a instauré une série de taxes environnementales dont l’efficacité s’est manifestée par une forte réduction de la consommation. Selon l’AIE, la consommation d’électricité a en effet baissé de 12% entre 2007 et 2017 tandis que la production baissait de 15% entre ces mêmes dates.

Le recours accru aux importations
Le développement des interconnexions a permis l’accroissement des importations, essentiellement depuis la France (liaison de 2GW) et les Pays-Bas (1GW) augmentant notamment de façon très marquée entre 2010 et 2015. Les importations depuis la France ont marqué une nouvelle hausse de 25% en 2018.

Notons à ce sujet que Enerdata vient de publier ses statistiques 2019 qui confirment la place de la France en tant que plus gros exportateur mondial d’électricité, qu’elle détient quasiment chaque année depuis 1990.


Ces éléments doivent faire comprendre les 3 points suivants :
- L’exception britannique de réduction de la puissance pilotable installée n’est pas transposable à la France.
- Les mesures incitatives doivent concerner toutes les solutions décarbonées, y compris le nucléaire.
- Le signal prix sur le carbone entraîne mécaniquement la réduction de ses émissions.

Pour autant, les économistes considèrent que sa taxation doit s’opérer à charge fiscale constante, grâce à la redistribution intégrale de son produit vers les ménages.

Il est d’autant plus regrettable que la France se prive la progressivité de ce puissant levier en détournant son produit vers le financement de l’éolien et du solaire, ce qui est d’autant plus contre-productif que le mix électrique français est déjà décarboné

* Le lien de cette étude est malheureusement cassé, mais peut être retrouvé ici

Mise à jour du 05/02/2023
Malgré son caractère insulaire, la Grande Bretagne est connectée avec ses voisins, pour équilibrer son réseau électrique, particulièrement grâce aux importations depuis la France. Pour assurer des échanges appelés à augmenter en raison du caractère variable de son parc éolien, la Grande Bretagne a entrepris un renforcement considérable de ces interconnexions.
Le tableau du gestionnaire Eleclink reproduit ci-dessous en donne la mesure, soit 4000MW jusqu'à 2019 et 12100MWsupplémentaires à partir de 2019

mardi 21 juillet 2020

Eloge de l'élan vital


De la crise sanitaire dont nous émergeons à peine, au moins provisoirement, les enseignements ne sauraient être tirés sans avoir compris les défis qui nous attendent. 
Car c’est en évoluant avec son environnement que s’est perpétuée l’humanité et en affrontant chaque nouvel obstacle  qu’elle s’est donné les moyens de répondre à celui qui suivait. 
Notre adaptation aux défis à venir est à inventer et non à tirer du passé, dans un élan vital et non un repli frileux.
La nature vient d’illustrer la fragilité de notre condition, et nous interdit d’oublier que si l’infection par le Coronavirus semble pour l’instant sous contrôle, l’avenir reste lourd de menaces. 
Car nous resterons exposés aux maladies, mais aussi à la faim, la soif, à la perte de liberté et aux effets inquiétants de la croissance démographique.
Mais contrairement à l’idée répandue par des chants de sirènes, pourtant dans l’air du temps, l’énergie la mobilité et le progrès proposent des réponses autrement plus cohérentes que celles induites par toute forme de décroissance ou de repli.

........
Lire la suite dans European Scientist .......
https://www.europeanscientist.com/fr/opinion/eloge-de-lelan-vital/

dimanche 12 juillet 2020

Wind turbines in Denmark


Wind turbines in Denmark


Intermittence and hydraulics

Focus on the Danish case


Jean Pierre Riou

English translation Bernard Durand

Avertissement : cette série d'articles en anglais reprend des articles du Mont Champot en français afin d'étayer une publication ultérieure.
Cet avertissement explicatif sera rapidement supprimé.
 
Why the development of intermittency in France will impose additional load monitoring on its nuclear reactors, which deteriorates their profitability and compromises their safety, without participating in the decommissioning of any of them.

Costa Rica, Uruguay, Quebec and Norway generate more than half of their electricity from hydro power. A good part of this energy, stored in dams, allows them all the fantasies of production with intermittent means such as solar or wind.
But the problems raised by the Sivens dam project painfully remind us that this model is not universally applicable.
However there is no other mean of storing massively electricity than using hydraulic reservoirs. This is the reason why countries not having such an asset cannot reduce the installed power of their dispatchable power plants by a single MW in return for the development of intermittent resources, whatever their power.
This power of intermittent sources is likely to fall to less than 1% of its installed power when the wind drops, as this March 12, 2018 in Denmark.


"High pressure potatoes" can, however, fall on an entire week in Europe, while regularity of electricity supply to the network is essential. This explains why Germany has still not reduced its controllable fleet by 1 MW in return for 100,000intermittent MW. Similar is the case of Spain. The French are mistaking  if they believe that the closure of 3 GW of coal is due to  any reason other than the economy in electricity consumption due to the commissioning of the Georges Besse 2 plant for the manufacturing of nuclear fuel.
 The Danish case
The case of Denmark requires special attention since it has succeeded in 25 years in reducing its  fleet of coal-fired powerplants by 2 GW, from 10,214 MW in 1995 to 8,141 MW in 2015, in parallel with the development of 5 GW of intermittent  wind power. And that, without having hydraulic reserves allowing to cushion the vagaries of the wind production. The table below details this development


Deciphering
This evolution of the Danish electricity fleet can only be understood within the Nordic network with which it is closely connected, mainly with Sweden and Norway which supply it with almost all of its imports, and with Germany to which it exports its surpluses, as shown in the graph below which illustrates the development of its cross-border trade since 1990.


The red line drawn on this graph shows the evolution of the trend of these exchanges. Denmark was a net exporter in 1995. The exports/imports balance gradually decreased, until it became negative from 2011, and represented up to 17% of Danish consumption in 2015.
Nordic and Baltic hydraulics
The Nordic electricity network, which connects Sweden, Denmark Norway, and further on, Finland, Estonia, Latvia and Lithuania is characterized by a considerable hydroelectricity input, with the exception of Denmark and Estonia. Hydraulic power provided, in fact, 96.3% of Norwegian electricity consumption in 2016 and half that of Sweden, Finland, Latvia and Lithuania. These countries are largely using this facility to open or close their floodgates to regulate the network, as shown by the sudden variations in Lithuanian hydraulic production, below.


All Denmark’s eggs in its neighbors' hydraulic / nuclear basket
Nuclear energy also characterizes the electricity mix in Finland, where nuclear / hydro power accounted for 83.4% of electricity production in 2016 (excluding cogeneration), and  in Sweden for 80.3% of production (87% of consumption).
It is in fact the Swedish and Norwegian hydraulic reserves which allow Denmark to have power when the wind drops. And assure him a possible outlet for its excess of wind production, because these neighbors have no more difficulty opening floodgates for export than closing them to absorb surpluses.  Imports by Denmark are all the more important as its wind turbines produce less, and it becomes an exporter when the power of its wind farm exceeds, roughly speaking, 2800 MW. This is shown in the graph below, which also illustrates the strict correlation between the amount of wind power produced by Denmark and the amount of power it exports, or is forced to import.


Such behavior with such accommodating neighbors more than makes up for its lack of hydraulic storage capacity, and avoids having to subsidize emergency thermal power plants when wind is lacking,  as Germany does.

The hinge 2005 2015

Between 1995 and 2005, 2.5 GW wind turbines were added to the Danish electricity park almost without reducing the thermal park (minus 0.3 GW). This increase in installed capacity was, however, accompanied by a decrease in exports, due to an increase in consumption over the same period, as we can see in the graph below.


The horizontal red line highlights the similarity of consumption between that of 1995 and that of 2015, which frame this study, and without which any comparison would be biased.
It is the period 2005 2015 which is significant, since it was then that Denmark made most of the reduction in its thermal fleet. But also, from a net exporter, it has become an importer of 17% of its electricity needs, while its consumption fell regularly, from 34.2 TWh in 2005, to 31.7 TWh in 2015.

Epilogue

Its electrical system gives Denmark the most expensive electricity in Europe for households, with 0.3088 € / kWh in 2016, while its Nordic and Baltic neighbors benefit from a kWh 2 times cheaper: 0.12 € in Estonia, € 0.16 in Latvia, € 0.12 in Lithuania, € 0.15 in Finland, € 0.18 in Sweden and € 0.15 in Norway.
But at least the wind industry, with 25,000 jobs in Denmark, represented 8.5% of total exports, while the internal wind market represented less than 1% of activity in this small country in 2011, before China took over the market.

The other point of view

These figures were indicated in the letter sent by the industrial sector to the Minister of the Environment at the time, to remind him that the place of Denmark as European leader in this industry attracted the eyes of the whole continent on Denmark's wind energy regulations, and that plans to take into account the nuisance caused by their low-frequency noise risked being copied by other countries.
And that it would cause considerable damage to the Danish economy if the regulations concerning the protection of local residents were to be tightened.
This is roughly the content of this edifying letter, a sworn translation of which was published in a Finnish report (p 73/74 via Waybackmachine).

This letter is dated to the time when Professor H. Møller, undisputed acoustics specialist in Denmark, fought for wind turbines very low frequencies and infrasounds to be measured in homes and not just calculated. It was the time when he was sacked from the University of Aalborg where he professed. At which time this University spoke, on its own site, of the mafia practices of this dismissal on economic pretext, and the press also denounced these practices and paid him a vibrant tribute.


The price of intermittency


The price of intermittency


Jean Pierre Riou

English translation Bernard Durand


Avertissement : cette série d'articles en anglais reprend des articles du Mont Champot en français afin d'étayer une publication ultérieure.
Cet avertissement explicatif sera rapidement supprimé.


As of 11/30/2016, 11,292MW wind turbines were connected to the grid.

Almost all of these wind turbines are connected to the distribution network, medium and low voltage (MV and LV between 20,000 and 230 volts) which is managed by ENEDIS (ex ERDF).

Some 637MW are however connected to the public electricity transmission network (RPT), composed of very high and high voltage lines (THT and HT between 400,000 and 63,000 volts) that RTE manages.
Transformer stations located at the interconnection between these networks.


ENEDIS, publishes its network data in real time: at http://www.enedis.fr/le-bilan-electrique-erdf
Which indicates, in particular, wind production on its network:


Which, logically, slightly lower than the RTE figures.

The large random variation in wind power, however, prevents most of their production from being consumed locally, as appears from the comparison of this production with the power delivered at the same time by ENEDIS to the RTE network. 


 These two variables are strictly correlated.

The more one considers wind energy on a local level, the greater the amplitude of the variation in its power.
Thus, even on the scale of a territory like Ireland, wind power can fall strictly to 0 ... and even to negative figures,
since the servitudes of the machines (extractors, hydraulic pumps, heating of the blades in cold regions ...) operate permanently. As illustrated by Irish wind turbines on October 20. 


Their power "curve" hardly took off from 0 MW that day, with even a foray into negative values ​​(minus 2 MW) at the end of the afternoon! It is because of this great variability in its production that wind power is anything but local energy and that it requires thousands of additional power lines to allow its overproduction to be pushed back ever further, by making them go up to lines of higher voltage. This is what highlights the Derdevet report ,  which analyzes the constraints to come for energy transport networks.


The following graph illustrates this phenomenon at a German transformer station. With the connection of photovoltaic power stations, the dimensioning factor is no longer the peak of winter consumption, but the peak of summer photovoltaic production for much higher power flows. And it is no longer a question of routing current to local consumers (positive flow on the graph),
but to push it towards higher virus tension levels to spread it over all the territories

This report draws attention to the case of Germany alone, which requires, according to the scenario envisaged, between 132,000 km and 280,000 km of new power lines and between 43 GW and 130 GW of transformation capacity in order to allow forcing back more and more these random surpluses towards higher voltage lines. (p 45 of the report)
Currently, it is the safety margins that are reduced by network congestion due to the unexpected transit of these unwanted flows. In particular the German flows (not nominated, or loop flows) which reduce the available capacities of our lines by dumping their surplus wind turbines coming from the north to transport them towards the south of their territory. 


The appearance of loop flows such as those caused by the massive installation of wind turbines in the North of Germany, and the delay in the construction of high voltage lines towards the South, sometimes saturate the electrical networks of neighboring countries and weaken them (see figure). These countries are not paid for the services they render to Germany, the balance of transits being zero at their borders.

To avoid the risks of blackout, the Czech Republic has  warned that it plans to be able to block any new influx of renewable electricity likely to cause a failure of its network thanks to the construction of a giant phase -shifting transformer setting the admissible incoming power, which was to be commissioned in 2017.Poland also plans to install such equipment at the border with Germany.
The need to deploy protective means such as these phase-shifting transformers can be taken as a demonstration that the presence of interconnection lines has not always had a positive effect. These have various interests, which shows, if this were still necessary, the need for appropriate technical and economic studies in each case.

Transit flows in the neighboring countries of Germany in 2011-2012 (MW)

Phase-shifting transformers
Transit volumes
Loop flows
Source France Strategy:  Union of energy

The advantages of this race towards ever more pooling of resources, needs, but also of problems, seems very limited by an inescapable parameter: the absence of benefit from a pooling of resources. The amplitude of variation of wind power remains considerable, even at European level.


To cope with the "high pressure potatoes" which deprive Europe of wind, it remains necessary to keep all the dispatchable power stations, ie those which supply current when a button is turned. But conversely, increasing intermittent energies productions results in the big difficulty of getting rid of their random surpluses as soon as the wind blows, even if it means paying for it, as demonstrates the correlation between German wind production and the price of MWh, which shows negative values ​​during wind records. 


But if these useless overproductions break prices on the MWh market, the various compensations paid to producers (purchase prices, additional remuneration, capacity mechanism, etc.) are added to the consumer's bill to the additional costs of the restructuring of the network allowing it to repress intermittent production. This explains the strict correlation between installed wind / photovoltaic capacity per capita and the retail price of electricity, as shown in the graph below.


Regarding the media bludgeoning on the virtues of renewable energies, it is disturbing not to find a word in the French press to salute the feat of the WEST reactor which has just obtained its 1st plasma in France, as part of the project ITER nuclear fusion industry. The silence is just as deafening on the entry into commercial operation of the Russian reactor of 4th generation "BN 800", crowned with the price of the best nuclear power plant in the world by the American press and ... which derives from the technology of Superphenix , arrested after its best year of operation for electoral reasons. Moreover this reactor offers considerable progress in the management of nuclear waste. So,  is it so obvious that the energy of tomorrow will not be dispatchable that  such a share of public money is injected in the creation of infrastructures whose sole purpose is to try to bear the effects of intermittence? In any event, these considerable additional costs must currently be taken into account when comparing the value of an intermittent MWh with that of a dispatchable MWh.